Can We Predict the Golden Globes? Our New & Improved Social Awards Season App
The Golden Globes are this Sunday, which means that it’s time for us to roll out our second annual Social Awards Season DataViz (short for data visualization), in collaboration with the brainiacs over at the global social analytics and monitoring company Brandwatch. Last year our one-of-a-kind Oscars prognosticator surveyed social media sites like Twitter, Facebook and Pinterest for any public mentions relating to the Oscar nominees. The DataViz also tallied the predictions of film critics, from news outlets like the New York Times to websites and popular film blogs. Our app used natural language processing and other measures to clean the data of duplicates and spam, and then analyzed it.
Our new app, however, is much more powerful, hence it's new name—The Social Awards Season App. For a first hand experience, click on the image below. Make sure your browser window is fully expanded to get the best experience!
Our results? Pretty astonishing—of the 18 categories we tracked, the DataViz was right 83% of the time, which made us the second most accurate Oscars predictor behind Tom O’Neil at Gold Derby, according to a round-up created by Slate (although we weren’t on it—maybe this year).
Speaking of this year, the DataViz has been improved considerably (and now includes TV shows nominated for Golden Globes). Now it will cover more than just the social buzz around award season—we’re now collecting social data mentions for the Golden Globes, the Screen Actors Guild, Directors Guild and Producer Guild Awards. The DataViz will monitor both daily and cumulative social buzz surrounding the various award ceremonies and categories, breaking down the differing opinions between the general public and the critics.
Another new feature is that this year, you will have the option to select how you want to view the data being collected: By award categories, by film title, or by television show.
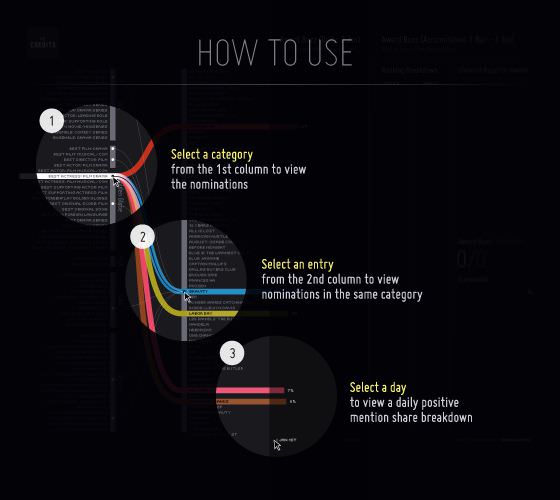
To view the nominee data, you just have to first choose a category on the left side of the viz. Clicking an entry in the second column displays the nominations in that same category. Color-coded highlights make it easy for you to see the different nominees and quickly view the overall competitive landscape across multiple awards ceremonies and categories.
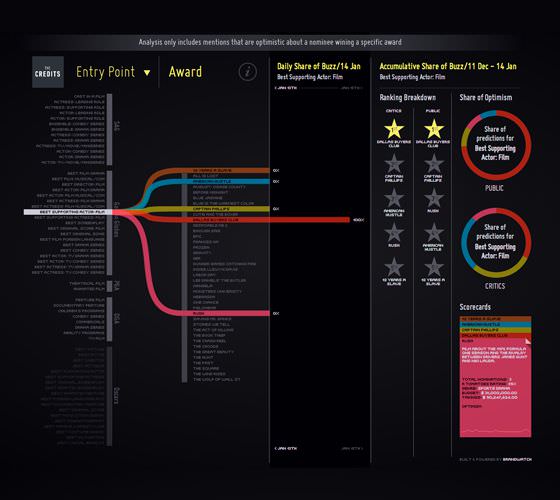
The share of positive social media conversation (which is gathered, cleaned and analyzed by Brandwatch) is shown to the right of the lists in both daily and accumulative breakdowns. Daily breakdowns can be reviewed on an individual basis by using the date selectors at the bottom of the screen.
A ranking on the right shows the “winners” of each award, as predicted by the public and critics, based on positive social buzz.
The Scorecards located on the bottom of the right side of the visualization provide additional data for the selected film or TV program, including a brief synopsis, total budget, number of nominations, and ranking according to Rotten Tomatoes.

